X--Ray Computed Tomography
In progress
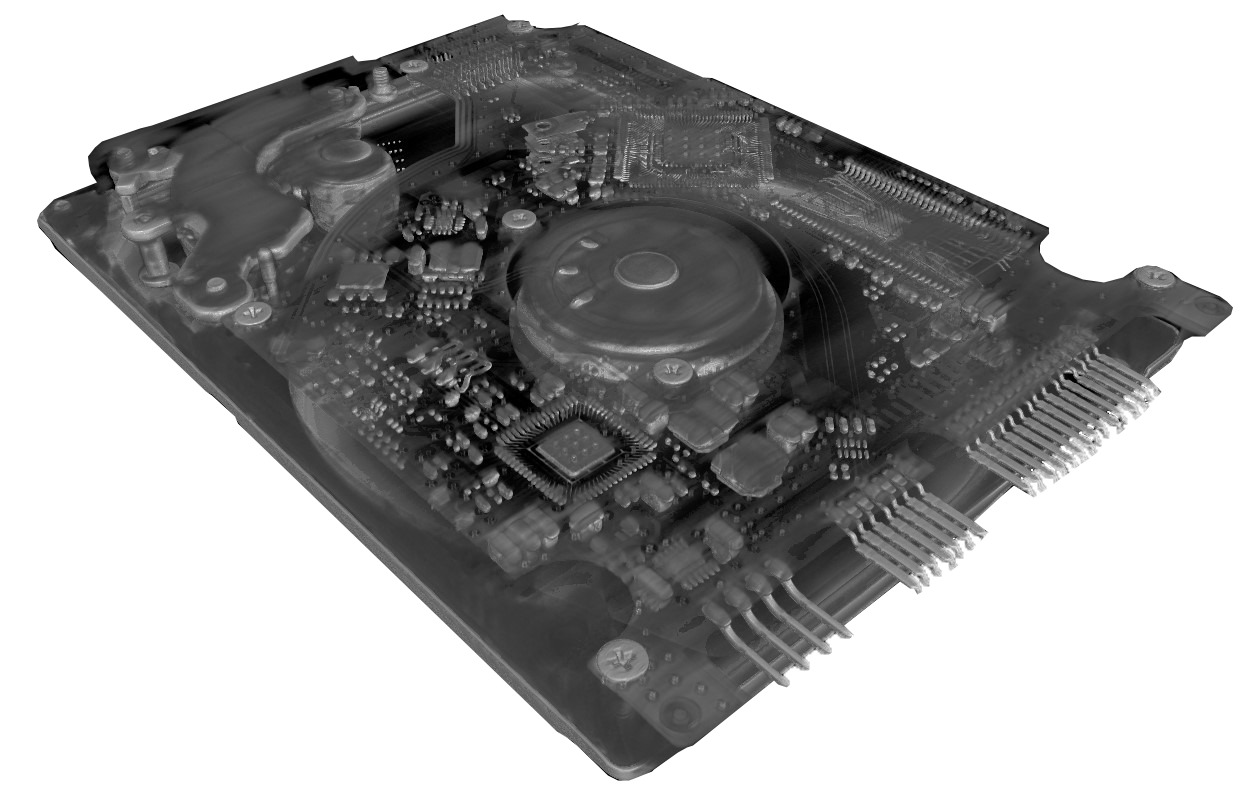
Source of thumbnail image: https://yxlon.comet.tech/en/technologies/industrial-ct.
Introduction
3D imaging is a powerful experimental tool with many modalities, including magnetic resonance imaging (MRI), and X–ray computed tomography (CT), and more. Each of these has pros and cons; for instance, MRI scanners do not leverage ionizing radiation to form images but the devices themselves require expensive and increasingly scarce cryogenic liquids to cool the superconducting magnet inside of the scanner.
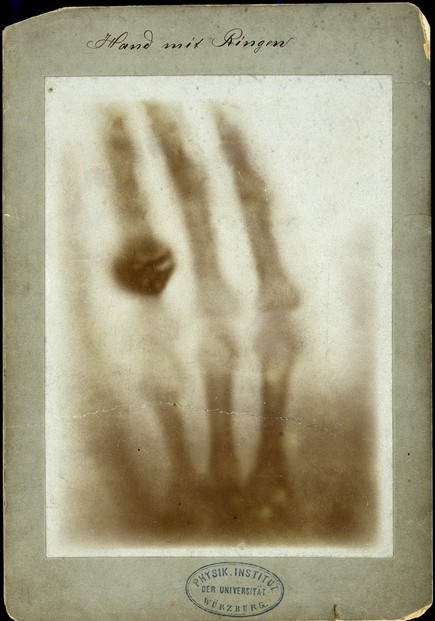
X–ray CT was first developed in the early 1970s, with the invention credited to Sir Godfrey Hounsfield and Dr. Allan Cormack, who were awarded the Nobel Prize in Physiology or Medicine in 1979 for their contributions. While the first CT scanners were designed for medical imaging, over the decades, advancements in CT technology in resolution, speed, and accessibility have expanded its applications beyond medicine into fields such as manufacturing, archaeology, and botany. I refer to the use of CT in non–medical applications as “industrial CT.” Note that I refer to X–ray CT when I say CT but that CT can be performed with visible light, neutrons, and more.
This blog post details the principles of X–ray computed tomography (CT) that I learned as a CT systems engineer intern at VJ Technologies, an engineering firm that focuses on X–ray–based non–destructive testing for industrial and scientific applications.
CT Scanning
CT scans are reconstructed from 2D X–ray images called radiographs taken at various angles. The following section describes the exact process taken to do this, including the required relative motion of the object being scanned and the X–ray source/detector, radiography, and filtered back projection.
Looking at an Object From Different Angles
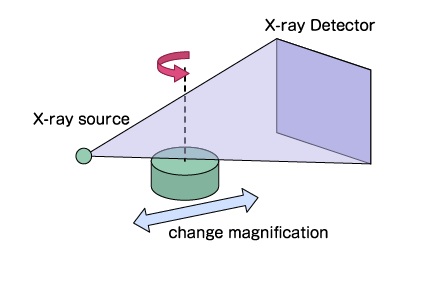
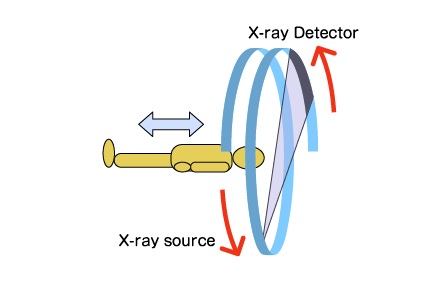
A CT scan works by revolving an X–ray source and detector around an object while capturing X–ray radiographs at each angle. Equivalently, the X–ray source and detector can be fixed in place while the object being scanned is rotated. In medical CT, it is advantageous to keep the patient fixed in place while the X–ray source and detector revolve around them, but you might find it funny to imagine the opposite case with you being slowly rotated at the doctor’s office. The CT scanners I used for industrial CT fixed the X–ray source and detector while rotating the object being scanned. This is often the most economical and maintainable option since the mechanical structure only needs to hold the source and detector in place.
To understand how this works intuitively, imagine you wanted to inspect the 3D structure of a chair. To do so, you would walk around it and perceive 2D images of it which you use in your brain to reconstruct an image of its 3D structure. You could also sit still while a friend rotates the chair in front of you. You likely understand that you don’t need to look at the chair from 1000 different angles to picture its 3D structure in your mind’s eye—3 angles might suffice! This alludes to an active field of research in applied mathematics called compressive sensing which, in the context of CT, involves reconstructing 3D images from a very small number of 2D images. Similarly, in deep learning–based computer vision, there exist so–called neural radiance fields (NeRFs) that use deep learning to represent a 3D scene from a small set of 2D images.
Radiography
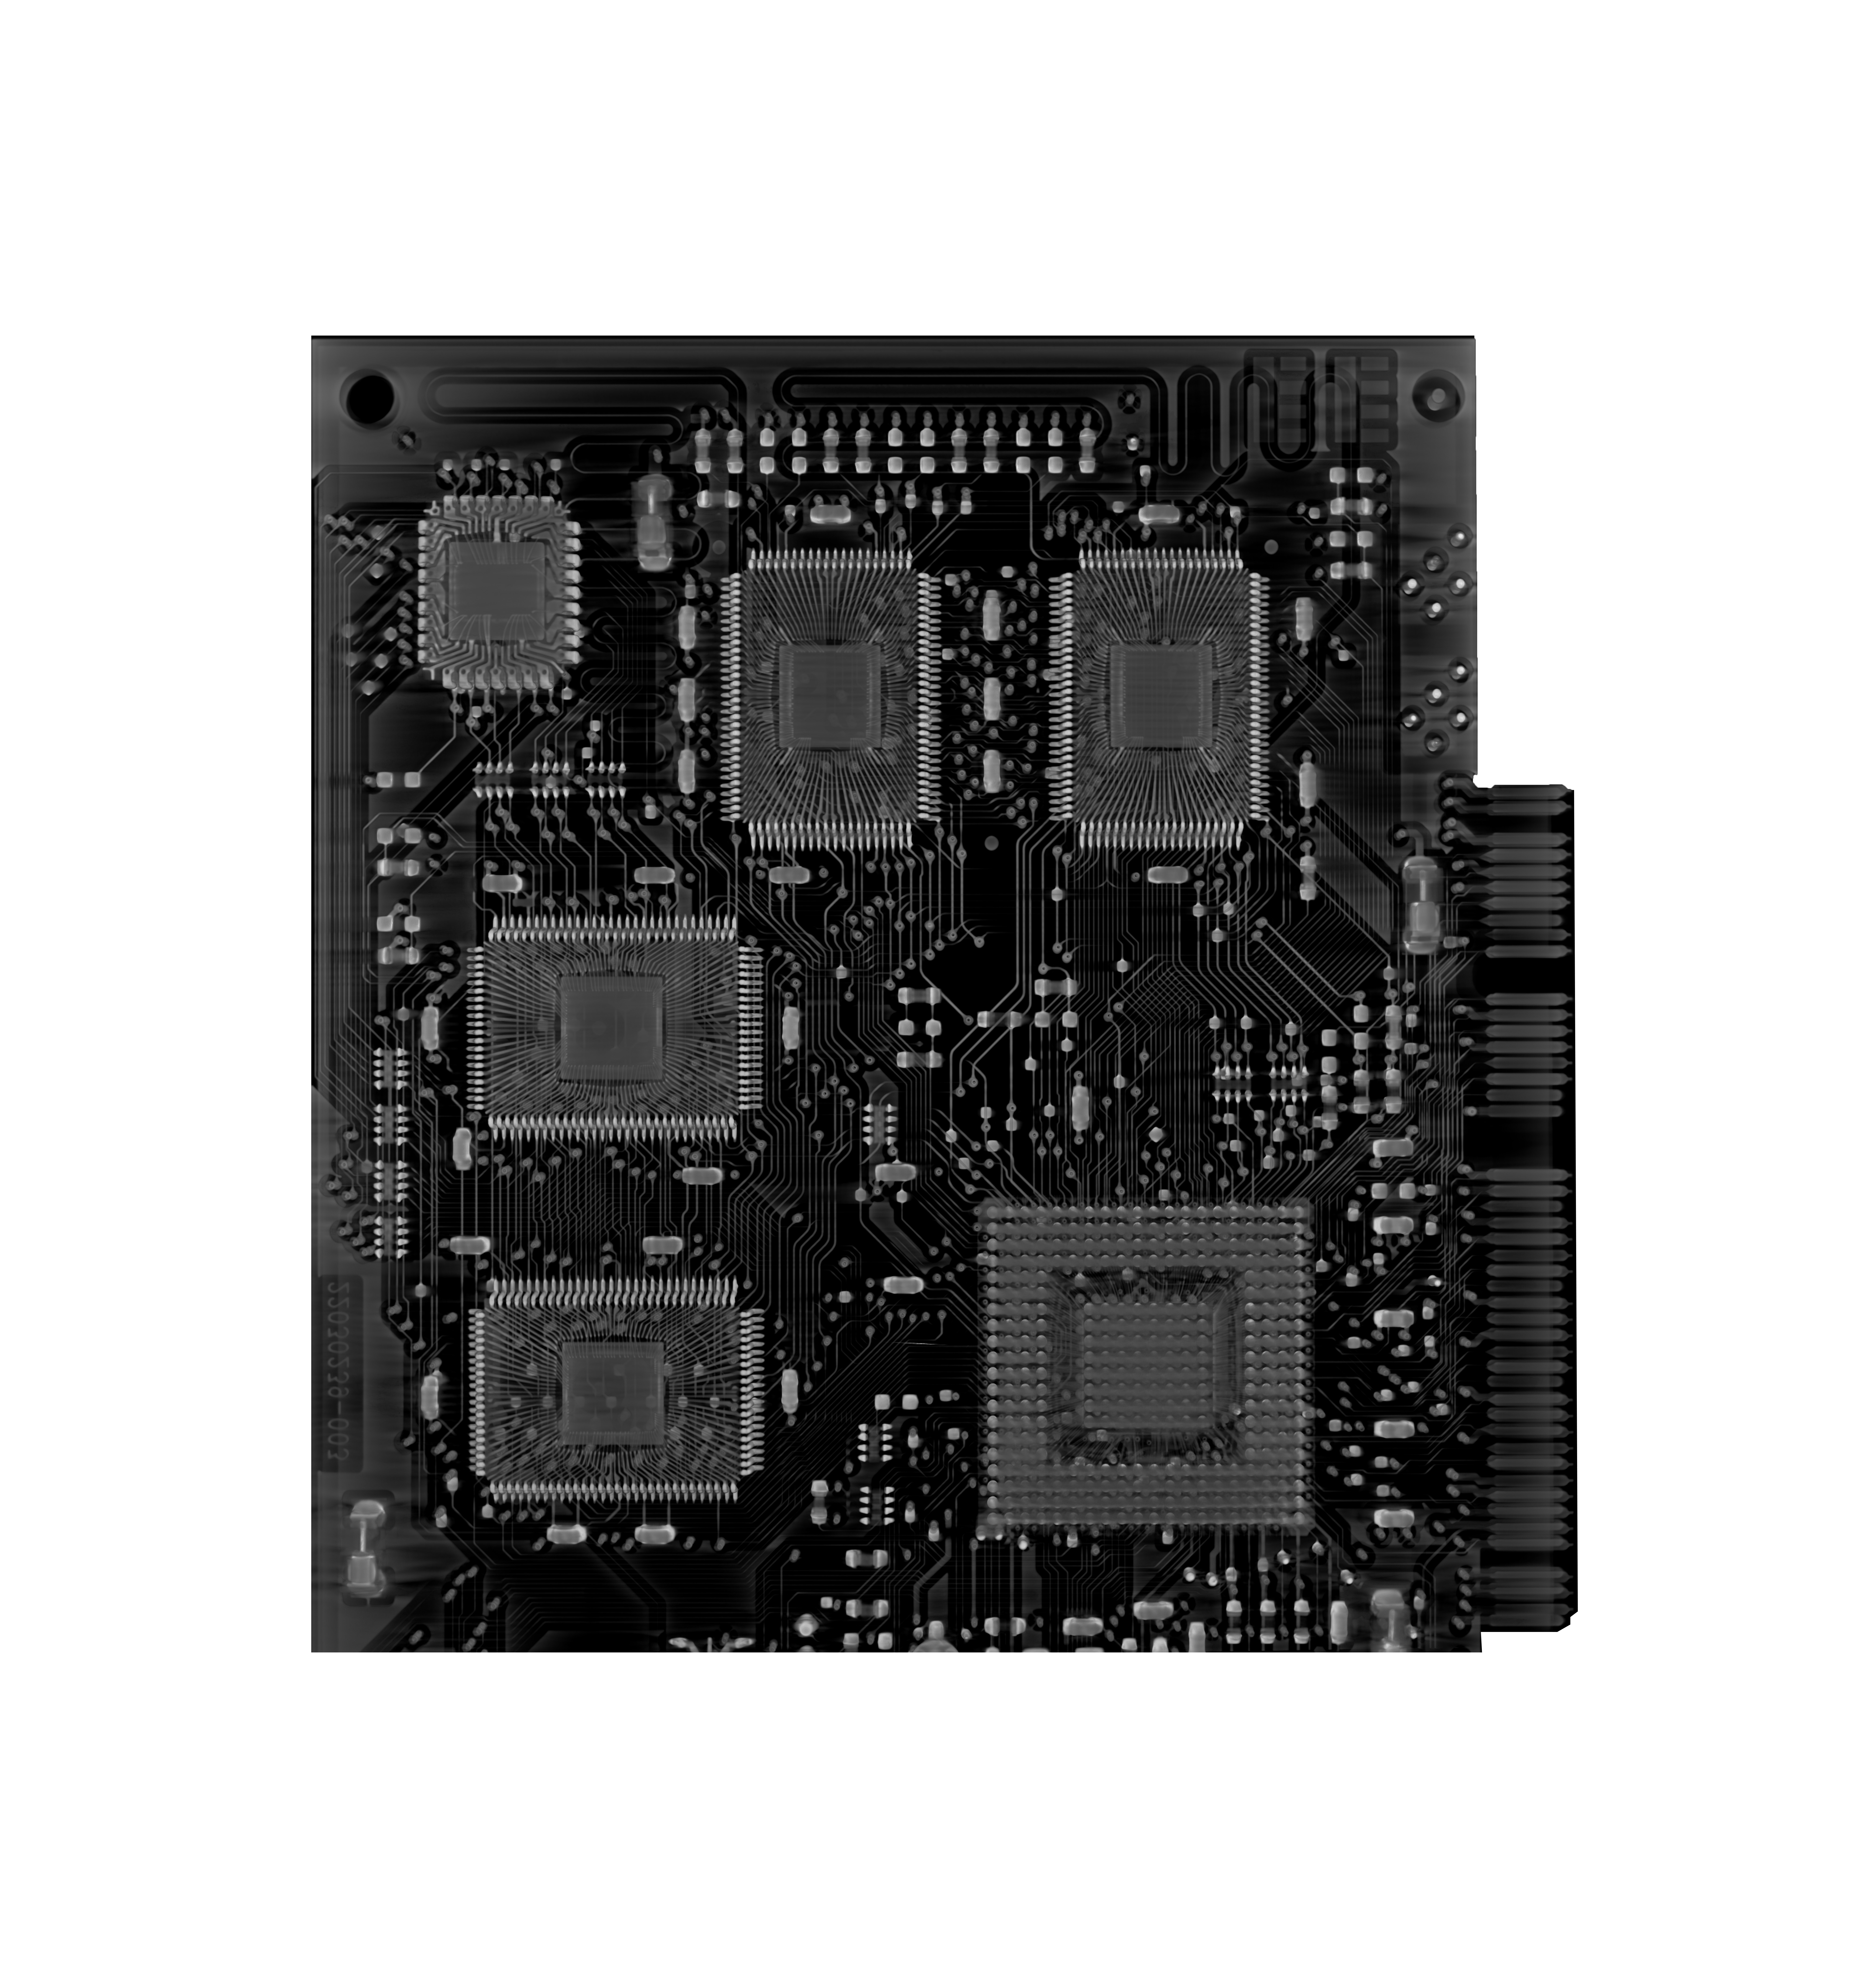
At each angle of the rotation/revolution, a radiograph is taken. This is a 2D grayscale image that quantifies how much of the X–ray radiation penetrated the object. Areas of lower density in the field of view will exhibit higher intensity in the radiograph since more photons of X–ray radiation will pass through that section and enter the active area of the detector, which is basically its “retina.” Conversely, regions of high density will attenuate the incident X–ray photons to a greater extent than lower-density regions, yielding relatively low intensity exiting X–ray radiation and thus relatively–low intensity values in the corresponding area of the radiograph. High-density regions can completely block X–rays, similar to how a concrete wall is opaque to visible light. However, objects are more transparent to higher–energy X–rays and, importantly, different substances exhibit different X–ray opacities. One of the jobs of a CT scanner operator is to master this interplay of X–ray energy and X–ray opacity: using X–rays with energy that are too low will render the object being scanned opaque to them, and radiographs will not be able to see inside of the object; using X–rays with energy that are too high will render the object being scanned transparent to them, and radiographs will not even see the object being scanned; using X–rays with just the right energy will render the object being scanned partially transparent so that there is contrast between different substances in the radiograph.
Notably, substances with higher densities will be more opaque to X–ray radiation. This is why lead—a very dense substance—is used to create shielding for X–ray vaults and personal protective equipment. However, interestingly enough, lead is too dense for its own good when it comes to structural integrity, as it becomes brittle under its own weight. Thus, structures are built with a layer of lead but mainly with some other material for structural integrity, like concrete.
Radiographs as Projections
In the context of CT, these aforementioned radiographs are often called “projections” because the intensity value registered by a detector element (dexel) is the initial intensity of the X–ray beam with exponential decay through each material it travels through without information about where such decay occurred. For a single substance of length $x$, the formula for the intensity is $I = I_0 e^{-\mu x}$, where $\mu$ is a function of density for that substance called the linear attenuation coefficient. For a discretized 1-dimensional path with a finite number of substances, this formula becomes $I = I_0 e^{-(\mu_1 x_1 + \mu_2 x_2 + \ldots + \mu_N x_N)}$. For a continuum domain with an infinite number of infinitesimally small substances, this formula becomes $I = I_0 e^{-\int \mu(x)\,dx}$. Notably, the evaluation of these formulas summates/integrates out the information about space. Thus, the intensity values registered on a radiograph contain no information about where in an X–ray beam’s trajectory the X–ray encountered a region of particular density—it only knows the result of the entire path! Information about attenuation is thus “projected” along the direction of X–ray propagation onto the dexel.
Back Projection
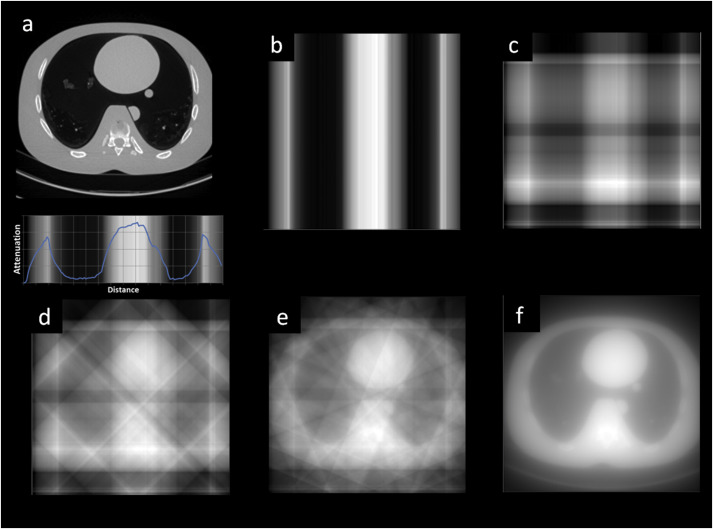
Importantly, if one obtains many projections at different angles, such as 1200 projection images, each equidistantly spaced at an angle between 0 and 180 degrees, then spatial information about the density of the object can be recovered. As alluded to earlier, this general process of converting 2D radiographs/projections into a 3D scan is called “reconstruction.”
A significant step in the reconstruction process is “back projection,” which involves taking the value registered at a dexel and populating all locations along the path in the direction that the X–ray was measured (i.e., co–linear with the ray path). This effectively un–projects the X–ray intensity by assigning all locations that would have contributed to its value with the resulting value. However, this makes no distinction between different locations along the path. Therefore, if an X–ray passed through both air and wood, both the air and wood would be assigned the same value registered by the dexel, even though the wood exhibits a greater density and thus a higher linear attenuation coefficient and greater degree of X–ray opacity/attenuation. To overcome this and obtain information about density in the object space, back projection must be performed on each of the projections obtained during the CT scan. The result will be a 3D image called a “reconstruction” with values proportional to the densities of the substances at different locations in the space. However, if one performs this reconstruction by only naively following these previous steps, then the result will be very blurry and unacceptable for analysis. Thus, an additional step involving filtering the projections is necessary.
Filtered Back Projection
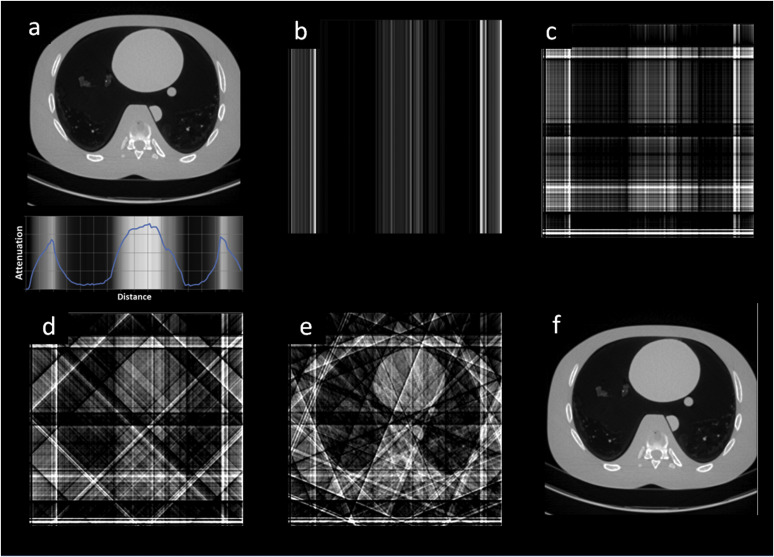
Filtered back projection (FBP) is the process of filtering projection data to back–project it to an accurate reconstruction. The filter in question is a 1–dimensional digital signal sharpening filter (e.g., Ram–Lak ramp filter, Shepp–Logan windowed filter). To perform FBP, it is helpful to store all the projection data in a single data structure called a sinogram. In a sinogram, the abscissa (x-axis) designates the dexel, while the ordinate (y-axis) denotes the rotation angle. A sinogram is constructed row-by-row, where each collection of intensity values registered on all the dexels at some angle is formed into a row and stacked on top of one another as the angle iterates from 0 to 180 degrees. For FBP, the blur present in the original back projection can be massively reduced by sharpening the sinogram row-wise with a 1D digital sharpening filter. Applying the previously described back projection process with data from this filtered sinogram will yield a 3D reconstruction image that is far less blurry. The overall FBP process is a large reason for the word “computed” in computed tomography.
CT Artifacts
In the ideal world, CT reconstructions would be unaffected by motion, CT scanner limitations, or material properties of the substances being scanned. Unfortunately, these factors can cause distortions or inaccuracies that appear in the reconstructions, yet do not exist physically, called artifacts. They are sort of like hallucinations of the CT scanner. These artifacts compromise the quality and reliability of reconstruction results and are thus important to understand, circumvent, and mitigate. There are many types of CT artifacts and each stems from a different source yet multiple artifacts can be present simultaneously. Here I describe the following artifacts: motion, ring, streak, and beam hardening. Understanding these artifacts is crucial for those interpreting CT results since one must differentiate between artifacts and their lack thereof to ensure accurate analysis.
Motion Artifacts
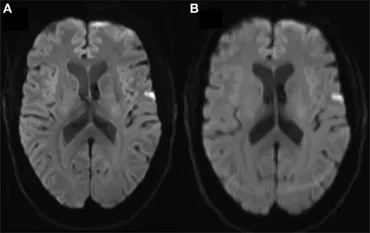
Motion artifacts are exhibitions of blurring due to movement of the object being scanned or the scanner itself during the imaging process. This can result in blurred or distorted images because the structures being scanned do not appear in the same position across the projections. Intuitively, if there is motion during the acquisition of projections, the FBP back–projects information about a single location in the object’s physical space to multiple locations in the reconstruction, yielding a blurred effect. Sources of motion are less common in industrial CT compared with medical CT (since medical CT scans involve scanning living beings) but can still occur. For instance, an inanimate object can wobble due to centrifugal force upon it during its rotation on a turntable during a scan, or heavy machinery can shake the X–ray detector during operation. These motion artifacts can obscure details and make it challenging—if not impossible—to accurately analyze the reconstruction.
Ring Artifacts
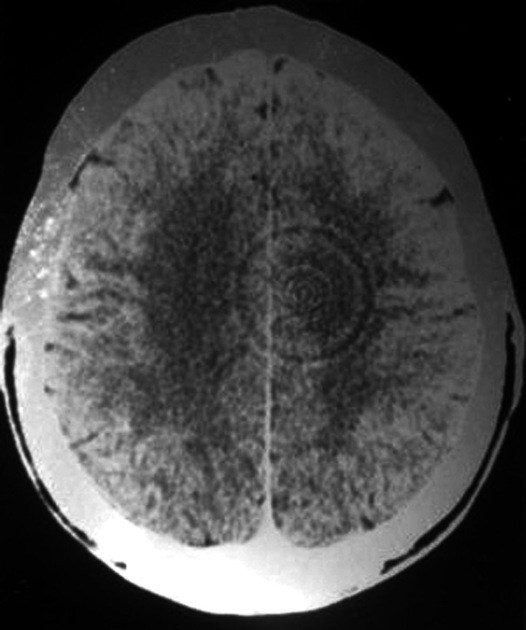
Ring artifacts are caused by the malfunction of dexels during CT operation, and they appear as concentric circles (i.e., rings) around the center of the CT reconstruction image. The circular geometry of these artifacts is due to the rotation of the scanner around the object being scanned. Basically, if one or more dexels are miscalibrated or broken, then they will register erroneous X–ray intensity values. If such a dexel registers this error at each angle of object rotation during the CT scan, then these errors will be back-projected into the CT reconstruction as a circular structure with the intensity of this erroneous reading, where the circular structure appears around the central axis of rotation. Thus, the circular geometric appearance of ring artifacts results from the combination of rotational scanning and persistent errors from malfunctioning detectors.
Streak Artifacts
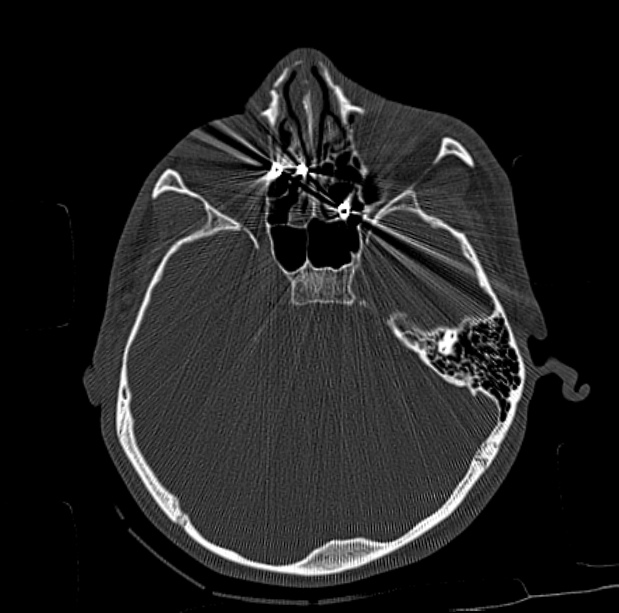
Streak artifacts are bright or dark lines of intensity emanating from high-density objects within a CT scan. Unlike ring and motion artifacts, streak artifacts can be difficult to avoid. This is because streak artifacts occur due to X–ray physics of Compton scattering and/or beam hardening rather than the environmental setup of the CT scan. However, they can be mitigated with image post-processing techniques and metal artifact reduction (MAR) algorithms (even if the artifacts are not caused by metal).
Intuitively, they occur when low–enough–energy X–rays encounter a dense–enough object, and thus scatter off of it. An example of this is when performing a CT scan on low-density plant roots where the plant was grown in soil with rocks. During the growth of the plant, the roots will latch on to small rocks in their vicinity. Even if the root is completely removed from the soil, some rocks will still remain in their grasp. During the CT scan, these rocks will be of a much higher density than the plant root. Now, while it is true that using high–energy X–rays would mitigate the streak artifacts generated by these rocks, doing so makes the plant roots transparent to the X–rays and thus unresolvable in the reconstruction used to analyze the 3D structure of the roots! Thus, the low–density of the plant root itself mandates using very low–energy X–rays to visualize them, which in turn creates streak artifacts when these low–energy X–rays encounter the rocks and Compton scatter off of them. Unfortunately, such streak artifacts can be extreme enough to make their intensity on the reconstruction indistinguishable from that of the plant roots.
Beam hardening streak artifacts are similar to the aforementioned Compton scatter–produced streak artifacts in that they are due to X–ray energy, but these are caused by absorption instead of scattering. These artifacts occur when X–rays passing through a relatively dense substance “harden” (i.e., lower–energy photons are absorbed during transmission through the material but higher–energy photons make it through). Ideally, the X–ray energy spectrum would uniformly attenuate during transport through media; however, some energies are absorbed more than others since materials serve as a “high-pass filter” to X–rays. This results in an increased average energy of the X–rays as they exit the body, leading to inaccuracies in the reconstructed image since substances are more transparent to a higher-average energy X–ray. In circumstances with extremely dense substances, photon starvation may occur where the extremely dense substance in question nearly fully attenuates the incident X–ray beam, resulting in few, if any, photons exiting from it towards the detector, yielding dark areas in the scan that are essentially X–ray shadows.
CT Scan Workflow
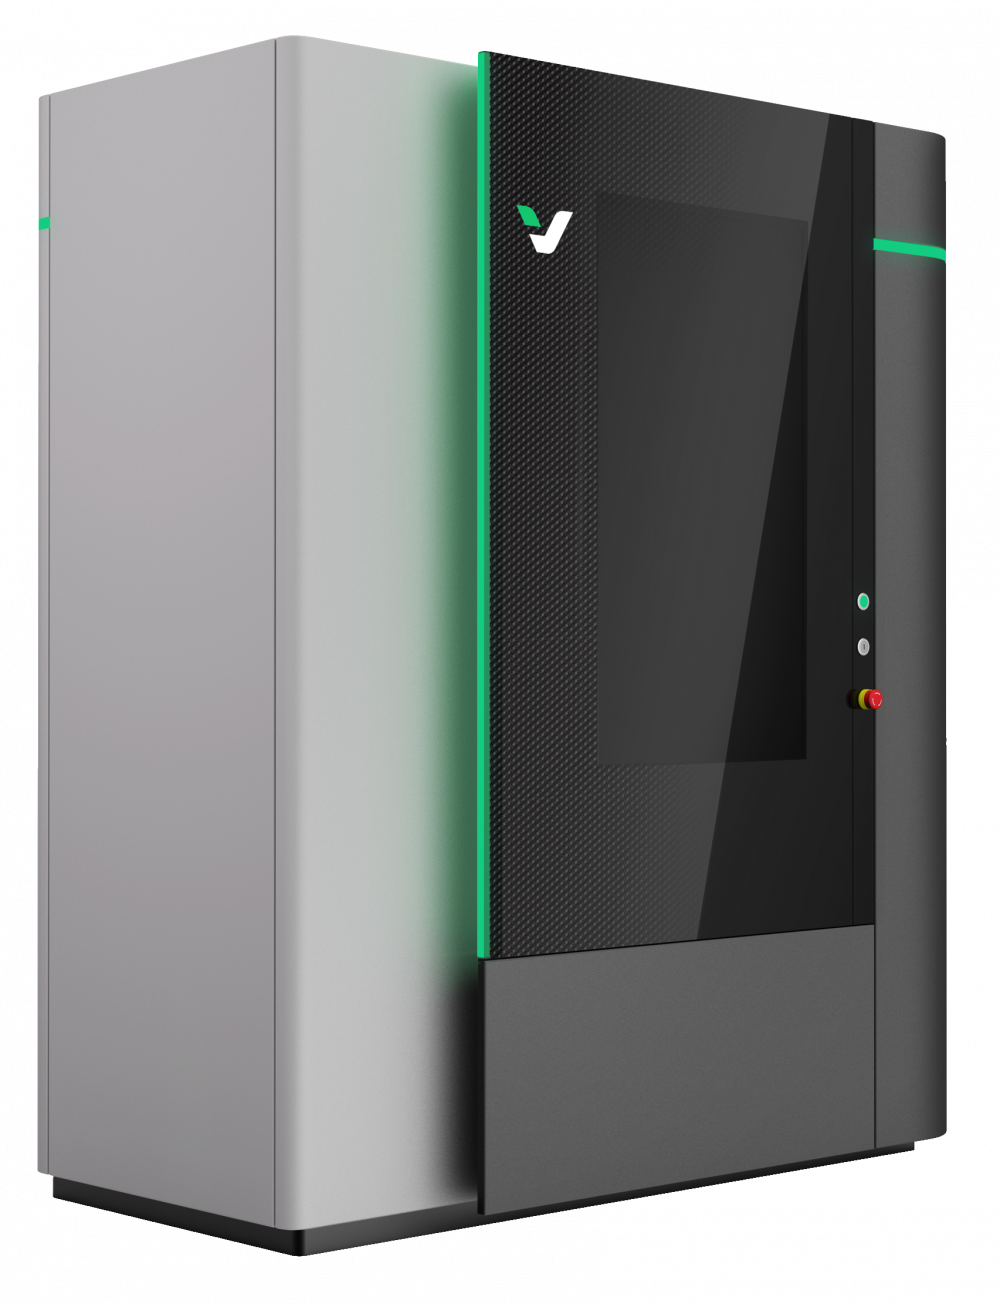
Performing a CT scan requires taking various steps to set up and perform the scan. The following section is written from the point of view of an operator of the VEDA CORE CT machine using vi5 software, both engineered by VJ Technologies. However, the steps presented are applicable to other machines. These steps include warm–up, geometry alignment, detector calibration, preheat, actuation, and scan. Once these steps have been completed, the operator can run a CT scan on the object that they wish to scan.
Warm–up
The warm–up phase is the first step of using a CT machine. This step involves ramping both the filament current and tube voltage gradually, from lowest to highest, in order to ensure that the machine can achieve them without extraneous strain on the system that might damage it. To understand how it works, it helps to understand the basic physics of how the X–rays are generated. Inside of the X–ray source is a filament which boils off electrons when heated. The temperature of the filament is set by the CT operator as a current parameter of the X–ray source. This is like how running a current through a wire will warm it up–in the case of the CT filament, it warms up and boils off electrons. Importantly, these electrons are charged particles, so they can be accelerated in some direction if a voltage is applied across some region. This is like how an object with mass will roll downhill due to gravity. However, in the case of electrons, they roll up the electrostatic potential “hill” due to their negative charge, where a difference in values of this potential is called a “voltage.” Intuitively, a larger voltage corresponds to a steeper slope on the potential landscape, causing electrons to accelerate faster. The CT operator controls this voltage, and it effectively determines the energy of the X–rays generated due to stronger impacts of the electrons on a target. For generating very high–energy X–rays necessary for CT scanning incredibly dense materials, like part of the chassis of a rocket, klystrons and other devices are used to build particle accelerators.
Often, the aforementioned accelerated electrons are directed at an angled block of tungsten. Upon near collision with the tungsten, the electrons slow down due to electrostatic repulsion, generating bremsstrahlung, also known as “braking radiation.” The bremsstrahlung is high-energy X–ray radiation generated due to the conservation of energy. The electrons have a continuous spectrum of kinetic energy due to motion, but they slow down due to electrostatic interaction with atoms in tungsten. This lost energy is thus converted into an electromagnetic form that is a convenient source of a continuous spectrum of X–rays. Characteristic X–rays are a separate source of X–ray radiation due to electrons colliding with a target, but they occur due to quantum mechanical effects rather than classical bremsstrahlung. These X–rays exhibit characteristic spikes in X–ray energy spectra with higher–energies than the bremsstrahlung.
But why do I need to run the warm–up when starting up a CT machine? Well, if one were to suddenly make the temperature of the electron source filament very high relative to what it was, then there is a risk of it getting damaged. This is like how runners are recommended to stretch before running since they could injure muscles if they suddenly subject them to strenuous exercise without warming up.
Importantly, the X–rays used for CT can actually damage the detector over time. Thus, during the warm–up phase when X–rays are generated without a need to use them for imaging, it is good practice to shield the detector from them. I do so with a lead brick placed in front of the detector, blocking X–ray radiation from the X–ray source. This is like how one might have a lead bib placed on them at the dentist when getting X–rays done in order to protect their vital organs, but here the lead is used to protect the detector since it doesn’t need to detect anything.
Detector Calibration
After warming up, one needs to ensure that the X–ray detector is calibrated to the intensity of X–ray radiation from the X–ray source. Doing so helps ensure accurate readings and prevent ring artifacts. To perform detector calibration, one needs to first ensure that the detector has a clear field of view of the X–ray source by removing any obstructions between them. Next, the operator must set the X–ray source to have the values of voltage, current, and integration time that they expect to use during the scan. After that, the operator must wait until the detector has adjusted its readings to the new mean intensity registered at the detector. Afterwards, the operator should turn off the X–ray source altogether to let the detector register its X–ray readings when the source is off (basically, to compute statistics about the background noise). Finally, the CT scanner software will calibrate the dexels based on information gathered in the previous steps.
Geometry Alignment
After the detector calibration phase is the geometry alignment segment. This portion is necessary for obtaining accurate reconstructions, but one can obtain radiographs just fine without doing it. In order to get an accurate CT scan, it is necessary for the software doing the reconstruction to have knowledge of the geometry of the setup: the distance between the source and object, called the source-object-distance (SOD); the distance between the source and the detector, called the source-detector-distance (SDD); in addition to the misalignment of the center of the source relative to the center of the detector along the x–, y–, and z–axes. These quantities are obtained through geometry alignment. However, to actually perform geometry alignment, one must acquire a scannable object with a very precisely defined geometry which can be hardcoded into the software of the CT scanner. When I did CT, I used a so-called alignment rod filled with steel ball bearings of known radius and distance from one another. Upon scanning this rod as a “geometry alignment” scan, the software detects the ball bearings and deduces the location of the rod based on how the radius it perceives compares to the radius it knows and how the distance between the bearings it perceives compares to the distance it knows. From this information, it can deduce where the rod is and compute the geometric quantities that are necessary for CT reconstruction. Other objects can be used too.
Now why exactly must geometry alignment be done with a particular object with geometry hard–coded into the software? Well, imagine that you want to gauge the size of a quarter by looking at it. A quarter right in front of your eye will look quite large but a quarter 10 feet away will look quite small in comparison. However, you, as a human who knows what a quarter is, understand that the quarter has a very specific size and that it will look smaller if it’s further away. Thus, you can deduce how far away it is at a given time based on how large it appears in your field of view! In a CT scanner, the hard–coded geometry is the CT scanner’s “knowledge” about the size of an object, and when it perceives it can then deduce how far it is based on how large it appears in its field of view. This enables the CT scanner to compute geometric quantities necessary for reconstruction, like the source–object–distance.
Importantly, if a CT reconstruction is desired, then geometry alignment must be redone each time that the SOD or SDD is changed. Additionally, before actually performing geometry alignment, the operator should place the object that they would like to scan onto the turntable and adjust the location of the object so that it fits into the field of view at all angles. Only after completing this step should the geometry be aligned, since running geometry alignment effectively tells the scanner to use the current SOD, SDD, and misalignment values.
